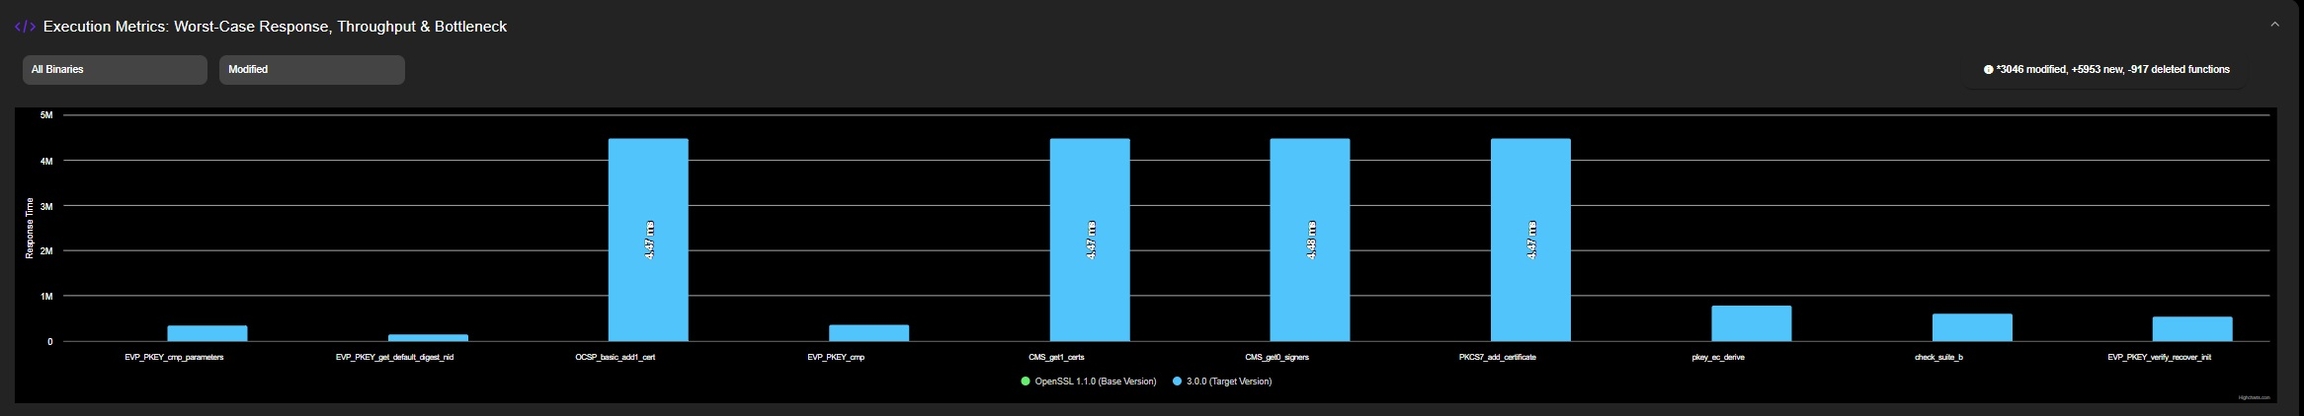
The chart identifies functions with the greatest absolute change in execution/response time between two points of comparison (Target and Base) — for example different builds, configurations, or code versions. The change is measured in delta units of time (not percentages) to emphasize functions that have the most impact on overall performance shifts, regardless of their relative size. This helps you quickly spot which parts of the codebase have regressed or improved the most in terms of raw throughput (for example, total execution time).
To keep the report focused on significant performance changes, only functions with a time deviation greater than 100 nanoseconds are visualized. This threshold filters out minor fluctuations that are unlikely to meaningfully affect overall performance, helping you concentrate on the most critical regressions or optimizations.
Filters implemented on the Report
Binaries: Select All or a specific binary
Functions: All, New, Modified, New/Modified
Notes on conditional display:
If there is only one version uploaded (Target), the “Functions” filter is not shown.
If there is only one binary in the version, the “Binaries” filter is not shown.
Single version - greatest absolute change in execution time
Comparing two versions (Base and Target) - greatest absolute change in execution time