Functions appearance
The appearance of the functions refers to different function shapes, different colors, and borders.
Functions by shape
Ellipsoid: Functions detected in normal data
Rectangle: Newly added functions in the software compared to the referenced version
Functions by colors
Vulnerable Function [gray color]: LOC (Lines Of Code) that is present in the static analysis but is not executed during run time, meaning it is not involved in any actual execution paths during testing. This code also has the potential to be considered as dead code.
Detected Function [blue color]: LOC that is executed and detected without deviation in behavior.
Deviated Function [red color]: LOC that is detected and has behavior deviation.
Functions by colors and borders
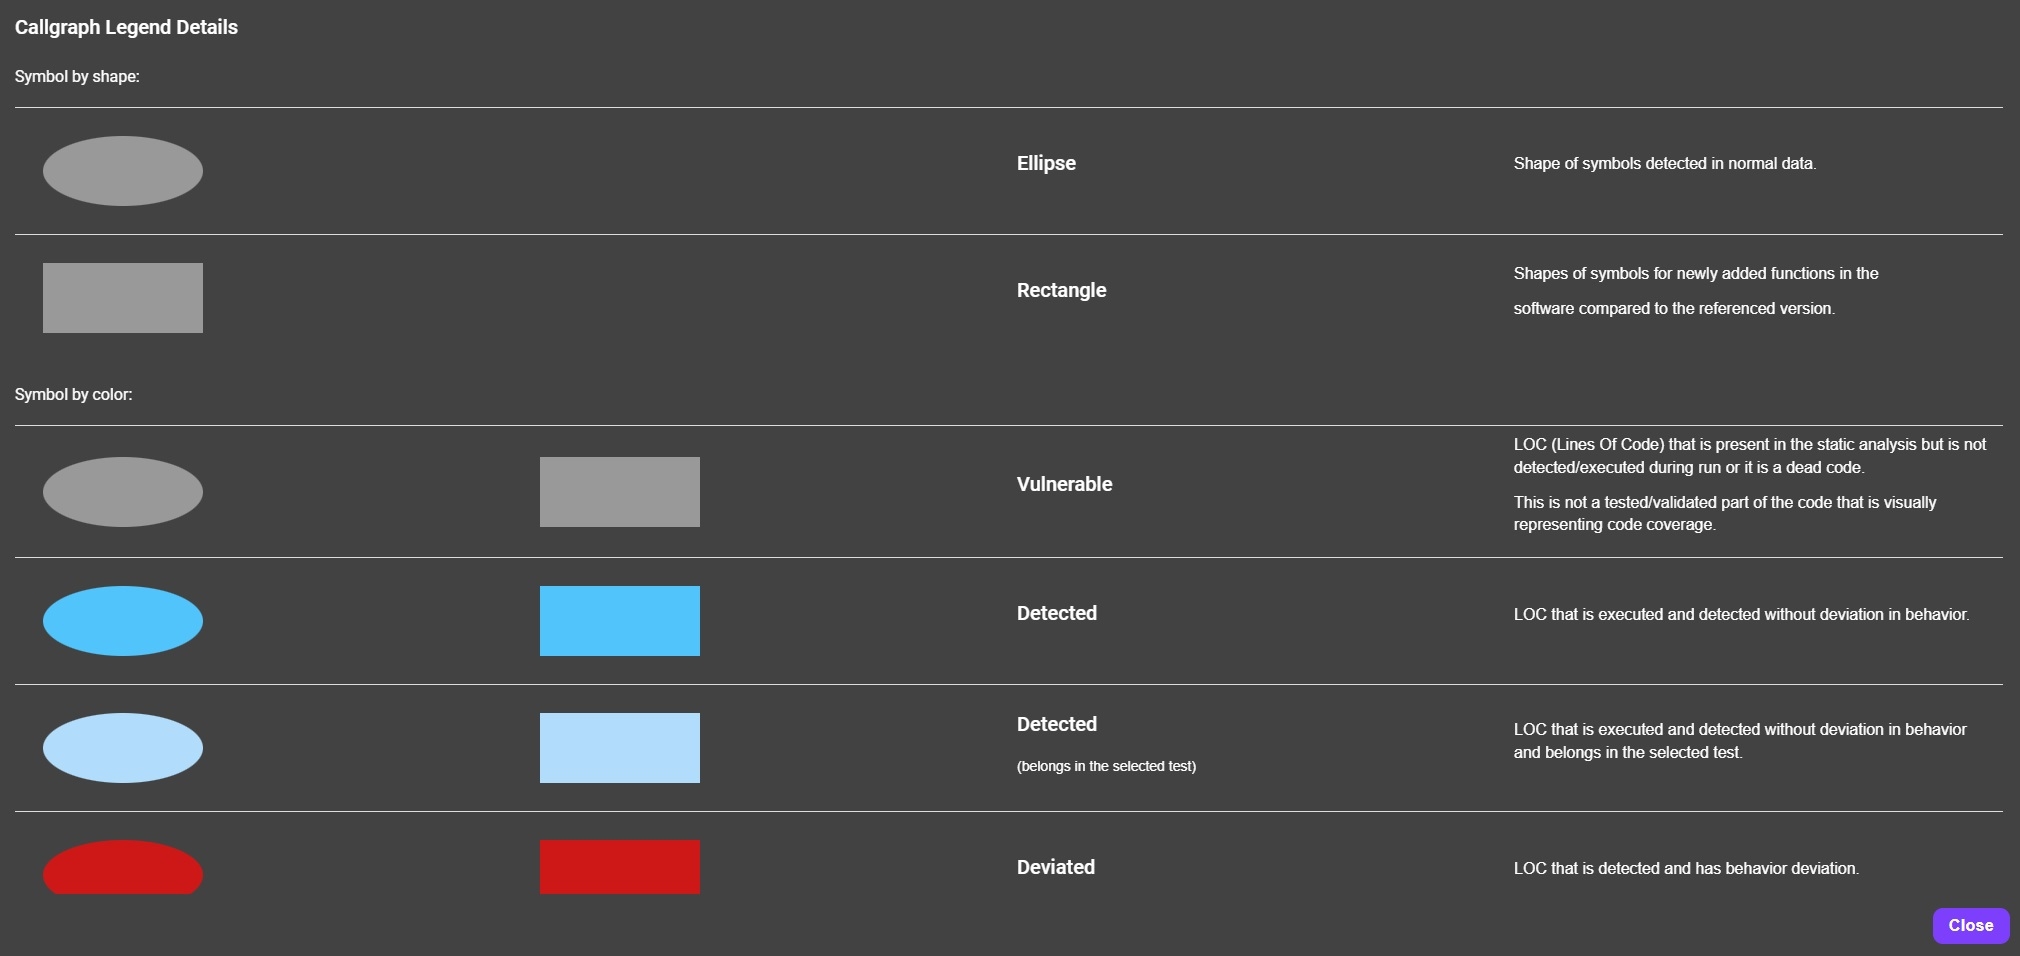
The ‘Functions’ are visualized with colors and lines.
Functions by color shade
Original color shade: Presentation of functions when the ‘Select Tests’ option is not executed.
Lighter shade of the original color: Presents the functions that belong in a specific and selected test.
On the CFI graph the following types of relations can be seen:
Vulnerable Relation [gray color]: Links that are present in the static analysis but are not executed during run time, meaning they are not involved in any actual execution paths during testing. These links also have the potential to be considered as dead code.
Detected Relations [blue color]: Links between nodes that are executed and detected without deviation in behavior during the static analysis.
Deviated Relations [red color]: Links between nodes that are executed and detected and have behavior deviation.